



Most massage practice KPI dashboards I've built started with 20+ metrics. After six months, owners were checking maybe three. The rest? Digital dust collecting in a spreadsheet nobody opens.
The problem isn't tracking too little—it's tracking too much without connecting metrics to actual decisions. You end up with a dashboard that tells you everything except what to do next Monday morning.
After building operational software for dozens of wellness practices, a pattern became clear: successful practices track eight core metrics that directly trigger operational changes. Not vanity numbers. Not feel-good percentages. Metrics that force decisions about staffing, pricing, and marketing spend.
The fatal flaw in most massage practice dashboards
Traditional dashboards fail because they're built backwards. Practice owners pick metrics that sound important—client satisfaction scores, average service rating, therapist productivity percentages—then try to figure out what to do with them.
The operational reality? A 4.2 satisfaction score tells you nothing actionable. Neither does knowing your therapists are "82% productive." These metrics create analysis paralysis. You stare at numbers wondering if 82% is good, bad, or just... Tuesday.
Real operational dashboards work differently. Each metric connects to a specific decision threshold. When utilization drops below 65%, you cut a shift. When same-day fill rate exceeds 40%, you raise prices. The metric triggers the action—no interpretation needed.
The 8-metric framework that actually drives decisions
Financial Health Metrics
Never miss a booking or double-book again.
Masthera helps you schedule, confirm & manage every massage session with ease.
- Unified appointment management
- Automated client reminders
- Therapist calendar coordination
No credit card required
1. Weekly Cash Position Not monthly revenue. Not quarterly projections. Weekly cash in minus cash out. This metric catches problems before they compound. A practice doing $28k monthly can still hit negative cash flow if membership charges fail the same week rent is due.
2. Revenue Per Available Hour (RevPAH) Total revenue divided by total therapist hours available. This single metric reveals pricing problems, scheduling inefficiencies, and demand mismatches. A $75/hour service rate means nothing if therapists sit empty half the day.
Operational Efficiency Metrics
3. Same-Week Utilization Rate Booked hours divided by available hours for the current week only. Monthly utilization hides critical patterns. A practice might show 70% monthly utilization while running 45% Mondays and 95% Saturdays—two completely different operational problems.
4. No-Show + Late Cancel Rate Combined percentage of appointments that generate zero revenue. Split metrics hide the real damage. A 5% no-show rate plus 8% late cancels means 13% revenue evaporation—enough to sink a thin-margin practice.
Client Behavior Metrics
5. Active Client Ratio Clients who booked in the last 60 days divided by total client base. This metric exposes retention problems months before they show up in revenue. A practice with 800 total clients but only 200 active ones is dying slowly.
6. Membership Utilization Rate Members who used their benefits this month divided by total members. Low utilization today means high churn tomorrow. Members who don't use benefits don't renew.
Growth Indicators
7. New Client Conversion Rate First-time visitors who book a second appointment within 30 days. This metric separates growth from churn-and-burn. High new client volume with low conversion means you're spending marketing dollars to fill a leaky bucket.
8. Referral Revenue Percentage Revenue from referred clients divided by total revenue. Practices above 30% referral revenue can start pulling back on marketing spend. Below 15% signals service or relationship problems that more advertising won't fix.
Dashboard wireframe that eliminates confusion
Forget fancy visualization software. The most effective massage practice KPI dashboard fits on a single screen—no scrolling, no tabs, no hunting for numbers.
Here's the layout that works:
Top Row: Immediate Action Triggers
-
Weekly Cash Position (big number, red/yellow/green indicator)
-
Same-Week Utilization (percentage with sparkline showing 4-week trend)
-
Today's Schedule Gaps (actual number of open slots)
Middle Section: Operational Health
-
RevPAH trend chart (8-week rolling)
-
No-Show + Late Cancel rate (with dollar impact)
-
Active Client Ratio (with month-over-month change)
Bottom Section: Growth Tracking
-
New Client Conversion funnel (this month vs. last month)
-
Membership Utilization heat map (by member tier)
-
Referral Revenue breakdown (percentage and absolute dollars)
Each metric displays three elements: current value, threshold indicator, and trend direction. No interpretation required. Red means act now. Yellow means monitor closely. Green means maintain course.
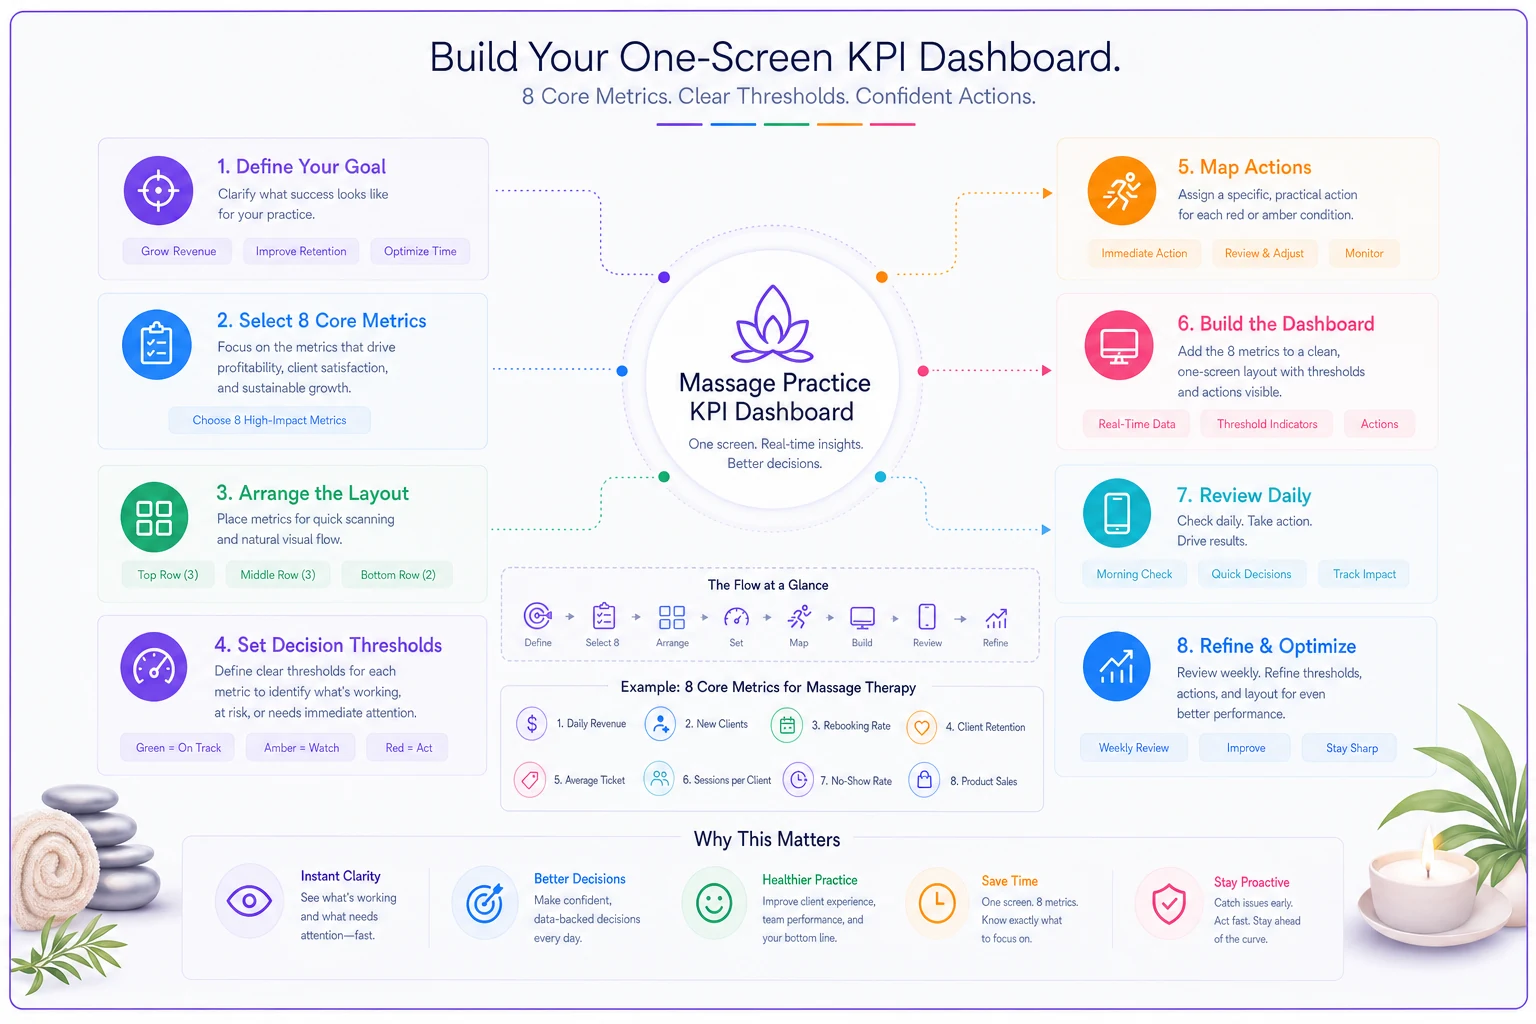
A simple wireframe like this makes it obvious what to act on and where to look first.
Decision rules that eliminate guesswork
Metrics without decision rules are just expensive decorations. Here's exactly what each threshold triggers:
Staffing Decisions
| Metric | Threshold | Action |
|---|---|---|
| Same-Week Utilization | Below 65% | Cut one evening shift |
| Same-Week Utilization | Above 85% | Add weekend or evening availability |
| RevPAH | Below $55 | Reduce therapist hours or increase bookings |
| Weekly Cash | Below 2 weeks operating expenses | Freeze hiring, accelerate collections |
Pricing Adjustments
| Metric | Threshold | Action |
|---|---|---|
| Same-Week Utilization | Above 80% for 3 consecutive weeks | Raise prices 8-10% |
| New Client Conversion | Above 65% | Test premium service tier |
| Referral Revenue | Above 35% | Reduce promotional discounts |
| No-Show Rate | Above 10% | Implement deposit requirements |
Marketing Allocation
| Metric | Threshold | Action |
|---|---|---|
| Active Client Ratio | Below 25% | Shift budget from acquisition to retention |
| New Client Conversion | Below 40% | Pause paid acquisition, fix onboarding |
| Referral Revenue | Below 20% | Launch referral incentive program |
| Membership Utilization | Below 60% | Email campaign to dormant members |
Metrics without decision rules are just expensive decorations. Here's exactly what each threshold triggers:
Reporting cadence that prevents information overload
Daily dashboards create noise. Monthly reports arrive too late. The sweet spot for massage practices: Monday morning snapshots and Thursday afternoon adjustments.
Monday Morning Review (15 minutes) Pull the 8 metrics for last week. Compare to the previous week and same week last month. Flag any metrics that crossed decision thresholds. Make one operational adjustment maximum—multiple changes at once muddy the results.
Limit Monday adjustments to a single operational change to accurately measure impact.
Thursday Check-in (5 minutes) Review current week utilization and cash position only. Thursday gives you Friday to fill weekend gaps or adjust next week's schedule. This mid-week gut-check prevents Monday morning surprises.
Monthly Deep Dive (45 minutes) Examine metric relationships. Low utilization plus high no-shows suggests scheduling problems. High conversion plus low retention points to service quality issues. These pattern reviews inform strategic changes, not daily operations.
When automation transforms dashboard management
Manual dashboard updates kill consistency. A practice owner spending 30 minutes daily pulling numbers from three different systems will abandon the process within a few weeks—it just happens.
Modern operational platforms consolidate these metrics automatically. AI-powered software can track utilization in real-time, flag threshold breaches as they happen, and suggest specific schedule adjustments based on historical patterns. The dashboard updates itself while you focus on clients.
Automated tracking also reveals patterns that are easy to miss manually. Systems can identify that Tuesday 2pm slots fill at 35% unless booked by Sunday, then trigger promotional messages to waitlisted clients Sunday evening. The same platforms can flag that members who skip two consecutive months churn at a much higher rate, prompting retention outreach before those clients disappear entirely.
Common dashboard mistakes that sabotage operations
The "Everything Dashboard" Tracking 25 metrics means tracking nothing. Every additional metric dilutes focus. Stick to the core eight until they're automated and actionable.
Percentage Blindness A 10% no-show rate sounds manageable. Losing $3,400 monthly from no-shows sounds urgent. Always convert percentages to dollar impacts.
Threshold Paralysis Setting thresholds too tight triggers constant adjustments. Too loose and problems compound quietly. Start with the ranges above, then adjust quarterly based on results.
Revenue-Only Focus Revenue is a lagging indicator. By the time revenue drops, the operational problem has been festering for weeks. Track leading indicators like utilization and active client ratio to catch issues early.
Real-world transformation: from chaos to clarity
Consider a 4-therapist practice in suburban Denver. Before implementing this framework, they tracked everything—service ratings, product sales percentages, individual therapist productivity, weather impact correlations. Twenty-three metrics total. Zero consistent decisions coming out of any of it.
After switching to the 8-metric dashboard with clear thresholds:
-
Identified Thursday afternoons consistently under 45% utilization, eliminated one therapist shift
-
Noticed new client conversion sitting at 31%, redesigned the intake process
-
Discovered membership utilization at 52%, launched a "use it or lose it" campaign
-
Caught referral revenue at 12%, implemented a bring-a-friend incentive program
Results after four months:
-
Weekly cash position improved from roughly $2,100 to $3,400
-
RevPAH increased from $61 to $74
-
Cut 6 weekly therapist hours while maintaining revenue
-
Reduced time spent on "analysis" from around 3 hours weekly to about 20 minutes
Results after four months:
Build your practice dashboard starting tomorrow
Don't wait for perfect data or expensive software. Start with a simple spreadsheet and three metrics: weekly cash position, same-week utilization, and active client ratio. Add one metric monthly until you reach eight.
Set conservative thresholds initially. Missing an optimization opportunity is far less painful than constantly adjusting operations based on noise. As patterns emerge, tighten thresholds to match your specific practice dynamics.
And commit to the decision rules. When utilization drops below threshold, cut the shift. When referral revenue exceeds targets, reduce discounts. The dashboard's value comes from consistent action, not perfect metrics.
Running a profitable massage practice doesn't require complex analytics or a business degree. It requires tracking the right numbers and acting on them consistently. Eight metrics. Clear thresholds. Simple decisions.
Everything else is just expensive noise.
Ready to elevate your massage therapy business?
Join hundreds of therapists using Masthera to save time, reduce scheduling conflicts, and enhance client satisfaction.